Star Coordinates
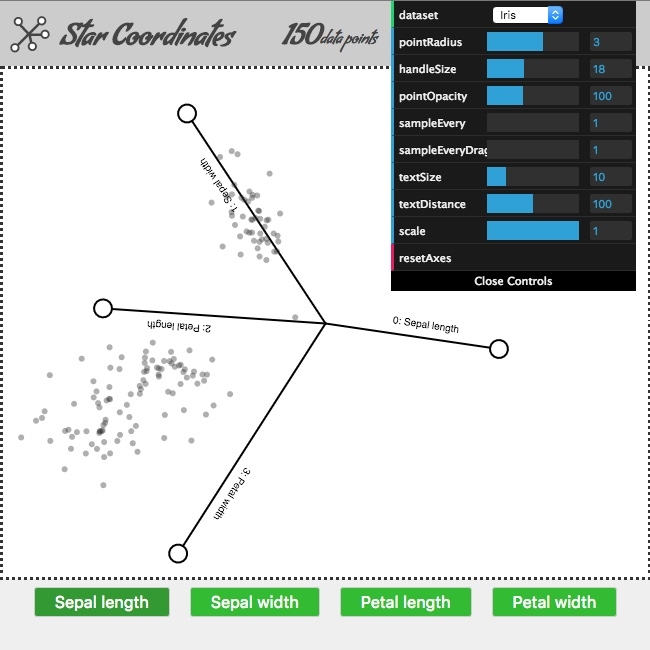
Star-coordinates is a way to map any amount of numerical dimensions to a 2D space. Drop a file, drag the dimensions, mark and filter the rows you need. Re-export as CSV.
https://kairollmann.de/star-coordinates

Challenge
Given a CSV and many columns of numeric data, you can only plot 2-3 dimensions in a single chart. Say you have a table of cities with a lot of properties per city, like weather, cost to live, population density, friendliness to foreigners. How can you explore this data to decide for your next vacation trip? Or maybe you have a list of users with a lot of KPIs. Maybe there are clusters in the data? But how to find out?

Solution
Introducing Star Coordinates. Originally described by Kandogan, star coordinates is a visualization technique that maps points from a multi-dimensional space into a 2D-projection. The projection can be explored interactively by scaling and rotating the axes, which form a star in the beginning. I couldn't find any openly available version, especially no in-browser solution. So there you go. Try it out with your own CSV-files.

My role
I implemented Star Coordinates with all recent hipster technologies: React, ES6, Redux, p5js, dat.gui, Papa Parse. Especially challenging was the interplay of the HTML canvas and GUI with a single-state redux app. I first prototyped everything and then added Redux to the mix.
All rights reserved.

